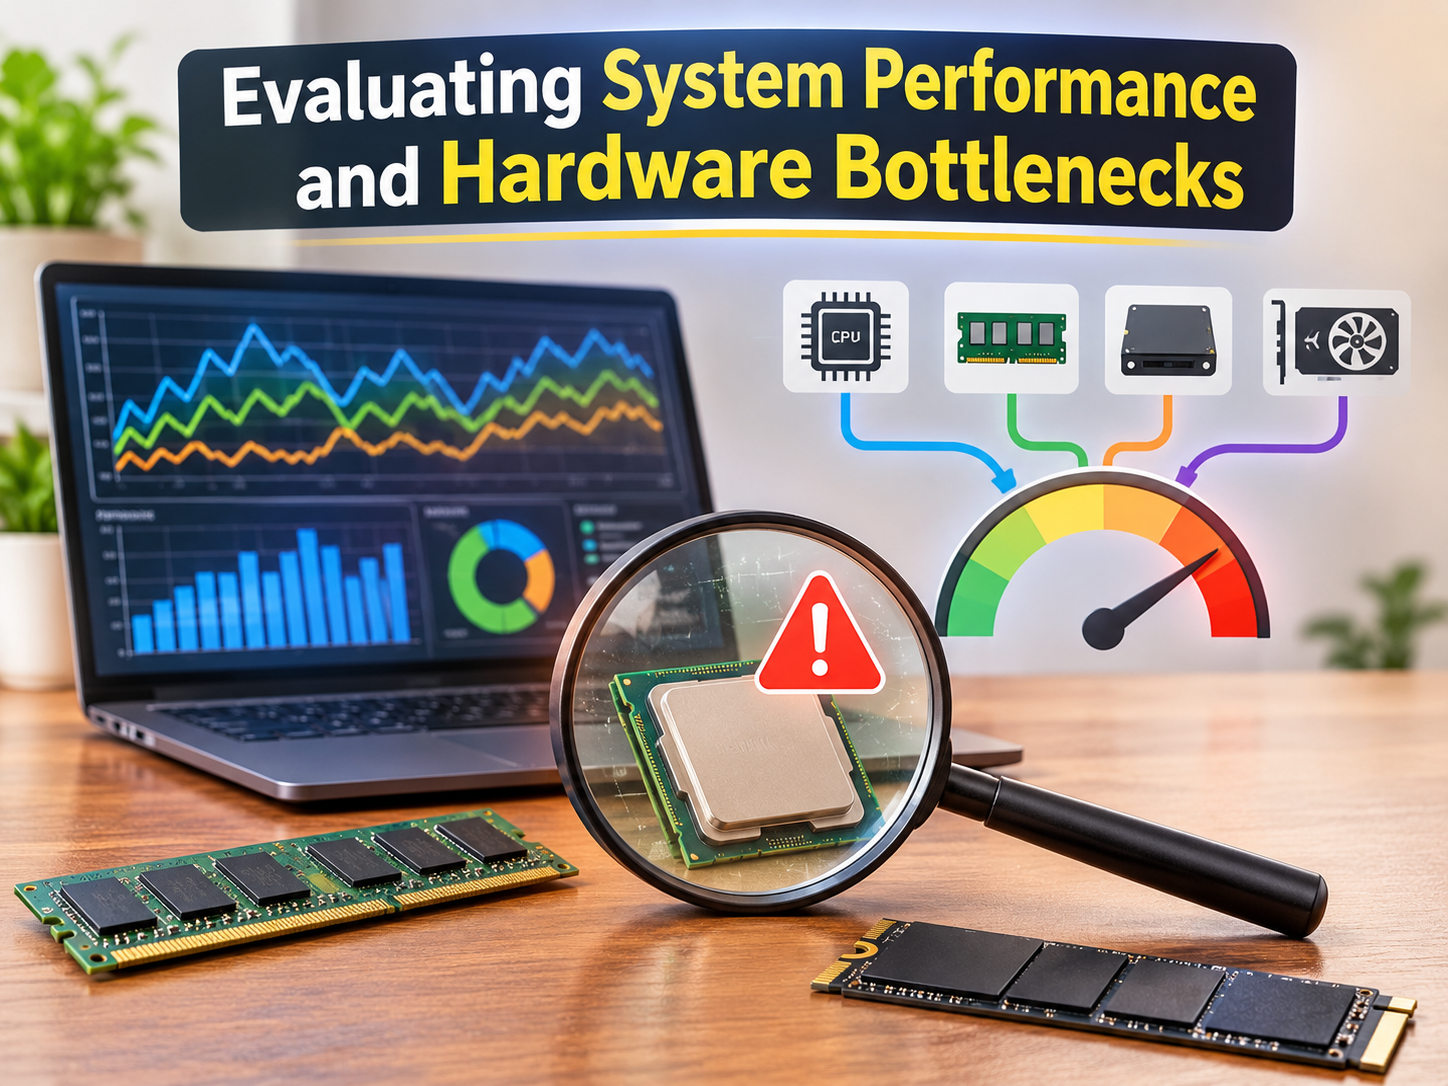
Evaluating System Performance and Hardware Bottlenecks
In modern computing infrastructure, evaluating system performance requires moving beyond theoretical maximums and analyzing how hardware behaves under actual, sustained operational stress. IT professionals, system administrators, and network engineers frequently encounter scenarios where systems that look incredibly powerful on paper fail to deliver expected responsiveness in production environments. This disconnect usually stems from relying too heavily on superficial metrics rather than understanding the complex interplay between processing nodes, memory hierarchies, storage architectures, and interface bandwidth.
To build, maintain, and optimize a reliable enterprise environment, one must distinguish between peak benchmark scores and real-world performance consistency. Identifying the true hardware bottleneck in a complex system is a critical skill that prevents wasted IT budgets on unnecessary upgrades and ensures that critical applications run with maximum efficiency and minimal latency.
Benchmark Scores vs. Real-World Workloads
When provisioning new servers or workstations, hardware vendors prominently display synthetic benchmark scores to highlight generational performance leaps. While these scores offer a standardized baseline for comparison, they rarely translate one-to-one with real-world enterprise workloads.
The Illusion of Synthetic Benchmarks
Synthetic benchmarks like Geekbench, Cinebench, or CrystalDiskMark are designed to isolate and push specific hardware components to their absolute limits for a brief period. A CPU benchmark might force the processor to render a highly complex 3D scene using all available cores simultaneously at 100% utilization. A storage benchmark might blast sequential data to an NVMe drive to record the highest possible read/write megabytes per second (MB/s).
The problem is that real-world applications almost never behave this way. Enterprise database queries, web server requests, and virtualization overhead generate highly randomized, bursty workloads. An application might require a rapid sequence of small data reads, pause for a millisecond to process that data, and then write a small chunk of data back to storage. In these scenarios, peak sequential speeds are entirely irrelevant; random I/O performance at low queue depths (QD1 to QD4) dictates system responsiveness.
[Image Prompt: A split-screen technical diagram. On the left side, a straight, wide highway representing synthetic benchmark sequential data flow. On the right side, a complex, multi-lane city intersection representing randomized real-world workload data flow.]
Mapping Workloads to Hardware Metrics
To accurately evaluate performance, administrators must map the specific characteristics of their workload to the corresponding hardware metrics:
-
Databases (SQL/NoSQL): Highly dependent on storage IOPS (Input/Output Operations Per Second), minimal latency, and high memory bandwidth.
-
Virtual Desktop Infrastructure (VDI): Reliant on high CPU core counts and massive amounts of RAM to prevent page-file swapping.
-
Media Rendering/Encoding: Dependent on sustained CPU clock speeds, AVX instruction sets, and fast sequential storage throughput.
By profiling the workload first, you can ignore misleading synthetic scores and focus on the hardware metrics that actually dictate software execution speed.
Understanding Performance Consistency Under Sustained Load
A common oversight in infrastructure planning is evaluating hardware based on short burst performance rather than sustained load. Modern silicon—whether CPUs, GPUs, or storage controllers—utilizes dynamic boosting algorithms. These algorithms push clock speeds and voltages extremely high for brief seconds to complete rapid tasks quickly. However, this peak performance is a temporary state.
Thermal Throttling and Clock Speed Drops
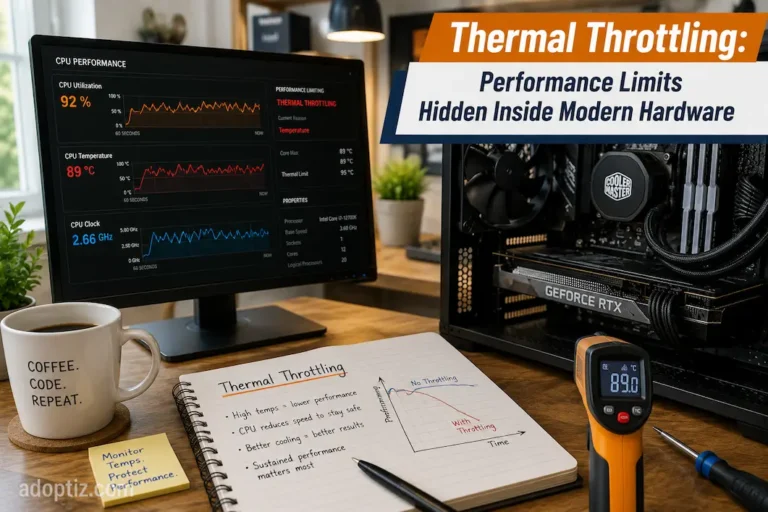
When a workload sustains 100% utilization for several minutes, the hardware generates significant heat. If the cooling solution cannot dissipate this thermal load faster than it is generated, the component will hit its Maximum Junction Temperature (TjMax). To prevent catastrophic physical damage, the firmware initiates thermal throttling.
During thermal throttling, the CPU or GPU aggressively lowers its clock speed and voltage. A processor marketed at a “5.0 GHz Boost Clock” might drop to a “3.2 GHz Base Clock” under a sustained 20-minute rendering or compiling task. Consequently, measuring performance during the first 30 seconds of a task gives a completely inaccurate projection of how that system will perform an hour into a heavy operational cycle. Rack, blade, and tower servers mitigate this with massive airflow, but environmental factors in the data center still heavily influence long-term clock stability.
Storage Cache Exhaustion in SSDs
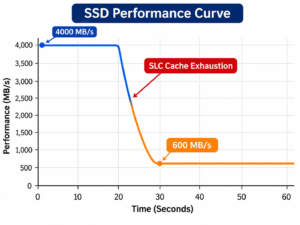
Performance inconsistency is not limited to processors; it heavily impacts modern flash storage. Most consumer and entry-level enterprise Solid State Drives (SSDs) utilize a technology called SLC (Single-Level Cell) Caching. To mask the slower write speeds of dense TLC (Triple-Level Cell) or QLC (Quad-Level Cell) NAND flash, the drive allocates a portion of its capacity to operate as ultra-fast SLC memory.
For short bursts, data writes to the SLC cache at maximum PCIe bandwidth. However, if a sustained write operation exceeds the cache size (e.g., transferring a 200GB database backup), the drive must start writing directly to the slower TLC/QLC NAND while simultaneously flushing the cache. Performance can instantly plummet from 3,500 MB/s to below 500 MB/s. Evaluating storage requires looking at sustained, steady-state write performance rather than peak cached speeds.
Strategies for Finding the Real Performance Bottleneck
A bottleneck occurs when the capacity or speed of one hardware component severely limits the overall performance of the entire system. Upgrading a CPU will yield zero performance gain if the system is actually constrained by slow storage latency. Accurate diagnosis requires understanding how components interact.
The CPU vs. GPU Imbalance
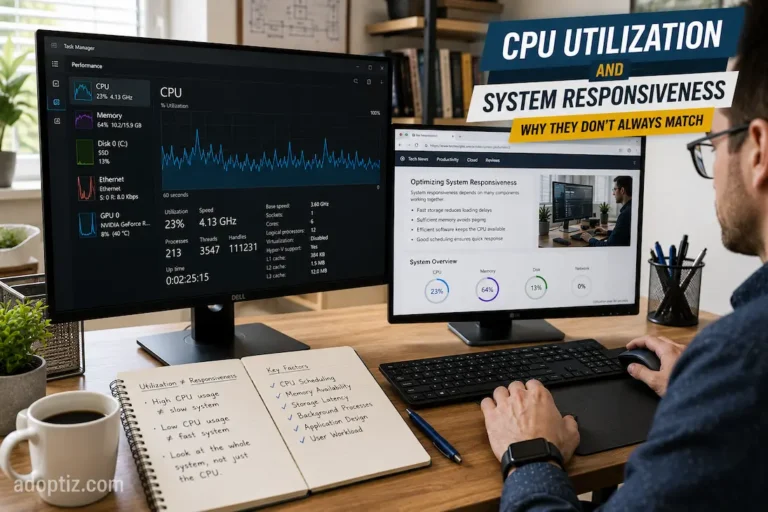
In computational workloads, identifying whether the CPU or GPU is the bottleneck involves monitoring utilization metrics. If the CPU is sitting at 100% utilization while the GPU is hovering at 40%, you have a severe CPU bottleneck; the processor cannot feed instructions to the graphics card fast enough. Conversely, if the GPU is maxed out at 99% while the CPU is at 20%, the GPU is the limiting factor. Diagnosing this requires granular monitoring tools rather than basic task managers, as a single-threaded application might max out only one CPU core while leaving the other 15 cores idle, presenting a misleading 10% overall CPU utilization figure.
Memory Bandwidth and Latency Constraints
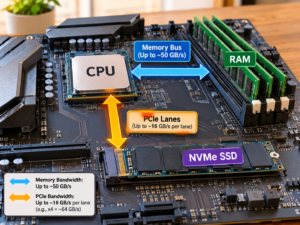
System RAM often acts as a silent bottleneck. It is not just about having enough capacity (preventing the OS from swapping to disk); it is about memory frequency and CAS latency. High-performance computing applications, such as in-memory databases or AI dataset training, require massive memory bandwidth. If the CPU requests data and has to wait dozens of nanoseconds for the RAM to retrieve it (memory latency), CPU cycles are wasted. This phenomenon, known as the Von Neumann bottleneck, is a primary reason why modern CPUs dedicate massive silicon real estate to L1, L2, and L3 caches—to keep data as close to the processing cores as possible.
I/O and Storage Limitations
Storage latency remains the most common bottleneck in older or improperly configured systems. Every time an operating system needs to load an application, fetch a library, or read a database table, it sends an I/O request to the storage controller. Even the fastest CPU in the world must halt and wait if the storage drive takes 10 milliseconds to find a file. Moving from mechanical Hard Disk Drives (HDDs) to SATA SSDs, and subsequently to NVMe SSDs, drastically reduces this wait time. When diagnosing system sluggishness, checking the “Disk Queue Length” and “Response Time” in OS performance monitors will instantly reveal if storage I/O is choking the system.
Diagnostic Tools and Monitoring Strategies
To implement these evaluation strategies, systems engineers rely on advanced telemetry and profiling tools. At the OS level, Windows Performance Monitor (PerfMon) and Linux tools like sysstat, htop, and iostat provide granular data on queue lengths, context switches, and page faults. For hardware-level diagnostics, tools that read direct sensor data—such as HWiNFO for thermal junctions, CPU package power (TDP), and VRM temperatures—allow administrators to map performance degradation precisely to thermal throttling events. By combining software workload profiling with hardware telemetry, IT professionals can definitively isolate bottlenecks and execute targeted, cost-effective infrastructure upgrades.
FAQs
1. What is the difference between IOPS and throughput in storage evaluation?
Throughput measures the total volume of data transferred per second (typically in MB/s or GB/s), which is crucial for large sequential files like video. IOPS (Input/Output Operations Per Second) measures how many individual read/write commands the drive can process per second, which dictates performance for randomized workloads like databases and operating system files.
2. Why is my system slow even though CPU utilization is under 20%?
Low overall CPU utilization can mask a single-thread bottleneck. If you have a 16-core processor but the software application is not designed for multi-threading, it will max out a single core at 100% while the other 15 remain idle. The system is bottlenecked by single-core speed, not overall multi-core capacity. Storage latency or thermal throttling are also common culprits.
3. How does thermal throttling affect sustained database performance?
When server processors overheat, firmware forces a reduction in clock speeds to lower temperatures. A 30% drop in CPU frequency immediately reduces the number of database queries the system can compute per second, leading to sudden latency spikes, application timeouts, and unpredictable transaction processing times during peak traffic hours.
4. Can upgrading RAM speed fix a bottleneck?
Upgrading RAM frequency and lowering latency only provides noticeable performance gains in memory-bound workloads (like heavy data compression, large-scale simulations, or integrated graphics processing). If your system is currently bottlenecked by a slow SATA SSD or a weak GPU, upgrading your memory speed will result in zero measurable performance improvement.
Authoritative Sources & References
-
Microsoft Learn: Windows Performance Monitor Data and Storage Profiling
-
IEEE Xplore: Architectural Bottlenecks in Modern Computing Systems
-
Intel Developer Zone: Understanding CPU Throttling and Thermal Dynamics
-
Storage Networking Industry Association (SNIA): Solid State Storage Performance Test Specifications